June 30, 2009

06/30/2009 intraday update

3:36pm

market breaks out the consolidation zone to the upside.  but usually the first break out is the false break.  let’s see how this one develops…


2:37pm

just come back.  market is still within the consolidation zone.   it’s planning something big here.


1:23pm

I will be out for 1 hour.  the chart is good so far.  stop is the upper boundary of box if you short. 


image


1:04pm

a good short entry on 1 min chart


image

June 29, 2009

06/29/2009 intraday update

3:55pm

We will close today’s trading in 5 mins and bulls are well in control today.  Is this the quarter-end window’s dressing and we have to see the true color of the market next month?


2:04pm

Market break down 50ema first time today, let’s see if it will hold.


image

June 28, 2009

06/28 weekly summary

In the past two weeks, markets gapped down on Monday and went lower.  so will third time be different?

SPX:  this chart is posted here two weeks ago when market is at the cross of red & green lines and I said I do not believe market has the strength to take out so many resistance level without a pullback.  now top is already in for the market and we can go down dramatically from here anytime.  the best case for bull is to retest the red line and kiss bye from there; good case for bear is we start falling from here right on Monday.  


image


Market will retest March 666 lows at least in this down wave.  this may sounds ridiculous for many, but i am so get used to this…  i shared this idea with a friend in a wedding last weekend at his request, then the whole talk after that become his bullish announcement.  He tried to save me from potential huge loss and convince me how good opportunity it is right now to buy and hold BAC and WFC for next 5 years.   I really do not have as much “facts” as he is having, like Obama policy, 401K effect, investor confidence level etc… my only evidence is my chart.   my chart told me at the end of the Feb that a huge rebound is coming while all the “facts” are saying market will never look back…  now my chart is saying financial sector will be very bloody again in the next few months and at least a few top 20 commercial banks will be removed from the trading list (nationalized). 


let’s just take a look at XLF:  XLF again finished the topping process a few weeks before the SPX and now is kicking off the start of wave 5.  Since wave 4 only retraces a small percentage of wave 3, i expect wave 5 will not be a truncated wave and at least take out the previous low. 


image


institution ACC/DIS chart is indicating something dramatic is coming… the red line could jump very high from here…


image

SPX Coin System

Mon: down

Tues: down

Wed: up

Thurs:down

Friday: up

June 25, 2009

06/26/2009 intraday update

3:56pm

did not have chance to watch market all day.  SPX is in green now!  will go through charts over the weekend and update here.  nice weekend~~~~


11:17am

market is down, but not as violent as i expect.


2:52am

it’s all about MJ tonight.  i found myself lost another piece of childhood today…


11:41pm

I am watching MJ’s performance in 1993 NY superbowl.  his music and dance will live on…


11:24pm

I did some homework just now and my system indicates tomorrow will be a big day for bears.

06/25/09 intraday update

1:57pm

“we may revisit 915-920 region in the coming days.  don’t be panic if that happens.  actually that’s the best entry of short position…”   this is we leaved here when market is in 890 region two days ago.  so be greedy when others are fear..


1:56pm

short financials and technologies here.


12:21pm

915-920 target reached.  add some short positions just now.  though target zone reached, the uptrend momentum is strong, so be cautious.  do not get your positions too heavy.   

June 24, 2009

06/24/2009

3:20pm

half time is over, US lead 1:0.  never expect this.  Spain has never loss since 2006 in last 34 games and they win last 15 games consecutively…


come back to market, market break down now and high is passed.  see where we make the call.   i expect some tomorrow or Friday will be very bloody…


image


2:57pm

wow, US scored first!!! so unexpected…


2:34pm

ESPN  US vs Spain


2:23pm

you see how volatile it is after FED meeting?  :)  truth will be told the 2nd day after major news--- this is a wall st code.


12:06pm

I am leaving for a while.  it’s time to load up shorts slowly.  may or may not have a final push… 


11:13am

yesterday i mentioned we will revisit 915 first before heading down… this is what’s happening now.  once we get there, load hard.

June 23, 2009

06/23/2009 intraday update

4:17pm

it’s indeed a doji pattern, indecisive and can be either way.  no break out 200ma intraday.  MACD hist has a lower low, means price will follow.


image


2:13pm

I don’t have much to update.  it’s really post-MDD behavior, doji is still likely


1:01pm

we may revisit 915-920 region in the coming days.  don’t be panic if that happens.  actually that’s the best entry of short position…


11:40am

it’s likely to close a doji after MDD day, watch out.

June 22, 2009

GLD

In the long run, I hold a very positive view towards gold.  with the current monetary policy, it’s just a matter of time for Gold to reach $1,500 or higher and the chart supports such a run.  However, I believe the trip of gold marching higher will not be that smooth.  There are so many people hold the bullish view towards gold like i am doing here, so there must be some volatile movement in the 600-1000 trading region before it finally takes off.


Today GLD broke down a key supporting line and left a big gap behind.  I guestimate we will not fill this gap in the coming months and GLD may visit 80 region first before any meaningful move.


image

IBD is still indecisive


this the big picture from IBD today.   i believe it will adjust its tune soon after we take out the 880 major support this or next week.  I think when bull market starts, it’s OK to follow IBD.  just buy leap call and hold them will benefit you well.  but in bear market, i think it’s good to follow me :)


“The market seems to be at a crossroads. The uptrend survives, but is under pressure, as per the Market Pulse.

The distribution-day count stands at three for the broad averages.

Higher-volume declines occurring three days last week, plus gains in weak volume Thursday, added to concerns for the market.

Monday's action heightened those concerns.

So how do you handle this market? With caution.

Protect your profits; don't let them turn to losses.

If a stock is acting poorly, this is not the time to give it the benefit of the doubt.

New stock purchases may be OK, but handle with care.

And don't try to anticipate a breakout. That's good advice always, but especially in a defensive market.”

06/22/2009 intraday update

3:58pm

everything as expected.  trend day, close at low of the day…


3:27pm

XLF leads the breakdown.  SPY will follow. 


3:05pm

another proposal, this one is a little bullish.  the rebound high will not exceed the 100% line


image


2:36pm

no rush to close your short positions.  a lot more downside to go… this is really just the start… in a trend day, we usually closed at low of the day.


2:18pm

CNBC is saying that energy looks toppy now.  but we say the same words 5 days early :)


http://rollinglines.blogspot.com/2009/06/uso_17.html


1:55pm

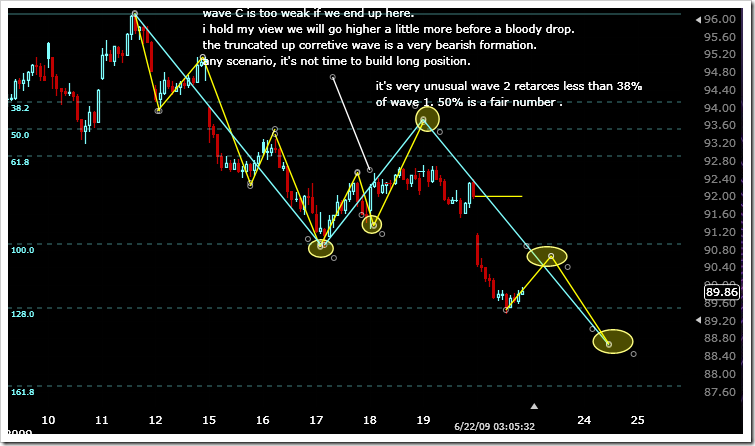
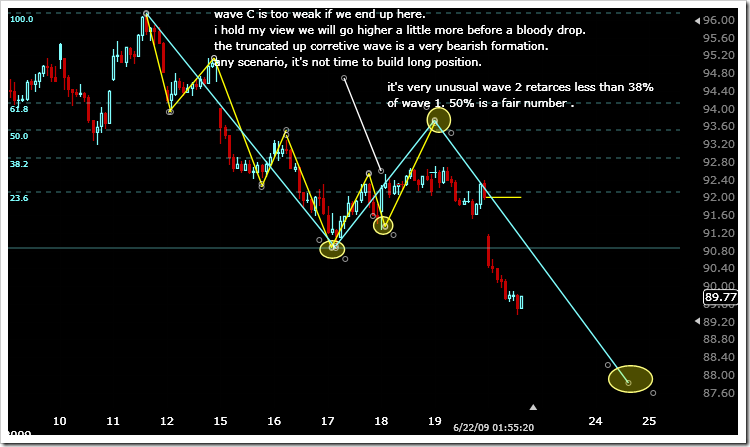
my view for next two days.  someone may say i was wrong, someone may learn a lot from this chart, it’s all about the perspective…


image


1:48pm

if we close like this today, it’s another MDD.  at early stage of a bear market, expect three MDD before a decent rebound…


image


1:42pm

approaching resistance again.  50ema, yellow line is my favorite…


image


11:53am

I wrote the intraday note last Friday noon that I am building short positions here.  now these shorts are doing really well right now.  one of them is JRCC.  the downside starts, this one is always the leader.  it still has lots of room, just short the next rebound…


11:39am

in celebration right now… you guys should be very familiar right now what is trend day and how it plays out.  so just find your favorite sector and build short.  a summary chart from google finance, just see how defensive sectors ourperform the rest.


image

June 20, 2009

06/22-06/26 coin system

Mon: down

Tues: down

Wed: Up

Thurs: down

Friday: down

June 19, 2009

06/19/2009 intraday update

2:24pm

a chart drawn back in early May.  It’s my 2nd choice at the time, but market seems like this one.  bear’s happy hour is here… :)

when you look at charts, pay attention to levels.  there are different time levels in the market.  also begin from large time frame and zoom in down to 5min/1min time frame.  or you lost the big picture. 

Even the chart below can only be regarded as mid level.  large level has to be on the monthly basis, if not yearly.


image 


1:34pm

it even disappoints me as a bear.  expect bull give another try before fade from here.


image


12:17pm

market is really weak.  it may push above 93 region, but i am building short positions slowly here.  Also today is the OE day, some of my friends are playing options expired today.  Sounds like there’s 10x, 20x opps everywhere, but i won’t try that…

June 18, 2009

06/18/2009 market review

SPX is now sitting back to the 200ma, a critical juncture for bulls.  Though prices has not make a lower low (880 region), momentum already goes before the price.  Checked the chart below.  Also, negative divergence will leads to further pullback. 


Also you guys have witnessed our intraday wave count and where we are now in the market. After this short-lived corrective wave is done, we will see sharp selloff coming.


image


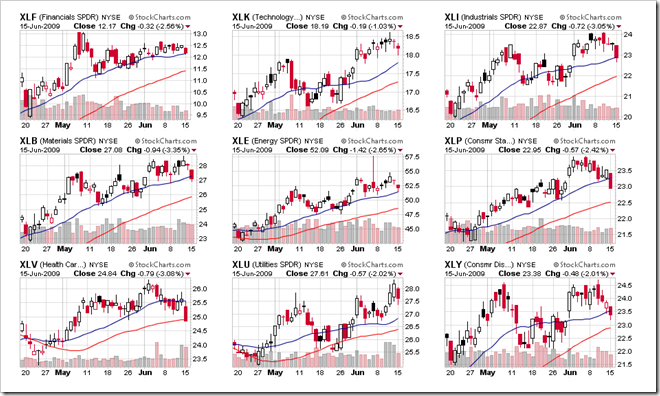
Let’s take a quick look at the sectors.  you may easily identify three strong white bars out of nine sectors below, right?   All of them are defensive sectors!  big money is looking for safety now and this rally won’t go anywhere.


image

06/18 Intraday update

8:46pm

if gap up big tomorrow, it’s a good short entry opportunity. 


Though this corrective wave has not finished the 50% retracement in price, it has finished that in time…  sometimes price and time can replace each other……


3:07pm

the market is even weaker than i thought.  next week will definitely be “wahahaaaa” time for bears… :)  will be out for rest of the day.  today tomorrow is the OE day, expect it to be wild…


2:44pm

uptrend lost the momentum.  let’s see how this consolidation plays out…


1:01pm

back to the track now…


image


11:58am


image


11:06am

one more thing before i leave for a while.  38.2% and 50% retracement are both potential reverse point for wave c.  my target drawn here is based on my own system.


11:03am

Very often, wave C accelerates to the target and has we may see a sharper slope here.  but i can not tell at this moment.  only market can tell.


10:58am

No surprise yet, right?  :)


image

June 17, 2009

06/17/2009 Intraday update

3:41pm

my preferred count.  Original drawing yesterday is enclosed in the graph…


image


3:03pm

very short term, uptrend is not violated. not short entry yet.  could be sometime tomorrow or Friday.


1:55pm

i don’t think you felt panic as a bear when you saw the last half hour rally.  it’s all right, just hold on and we are not there yet……


1:38pm

upside correction will last for a while.  i will let you know when we get into the short zone.  2nd entry is the best entry point…


image


12:58pm

our wave structure is nothing wrong.  but i am not sure a corrective is done here.  if so, that’s really a short one.


image


12:29pm

1min chart.  potential wave development. 


image


12:04pm

covered BAC.  $1.5 profit in three days.  still has other short position real time posted on trading blog. 


11:46am

even you know there may be a rebound coming, you don’t not to dip in longs here.  Play on one side is much safer.  just a remind…


11:39am

the subwave may not have finished yet and we will see another small down leg to 90.5 region. 


11:21am

no surprise from the market.  everything fits into our plan.  we will see some reversal from here.  some people may buy dip and call bull market continues, but time will prove, this is a bull trap…


image


6:38am

Now future indicates a tiny gap down.  the chances of filling the gap will be very high if market open here. 

USO

USO is inch away from my target posted weeks ago.  but it may not be there this time.  two reversal bars already with today a gap down.  very topping graph.

 image

June 16, 2009

06/16/2009 Intraday update

5:41pm

OK, i am back now.  there is surprise with the market and it’s getting closer to our zone.  A gap down tomorrow will fit everything into my plan well…

The friend i met is a doctor (not my Ph.D. kind of doctor, but really a doctor that see patient) and he has been trading for years.   He showed me his account on Ameritrade today and you know what, he is doing really good in the past three months… account doubled and almost no losing trade in closed transaction.  he strongly recommend the software he used “Vecter Vest”.  I’ve never used this one before and believe it won’t be fitted to my style.  but in case you are looking for something, it may worth trying. 


image 


2:36pm

Nothing much right now.  market is heading to our target smoothly.  I will see a friend in about half hour later, so may not update here till market close.  will update then.


1:32pm

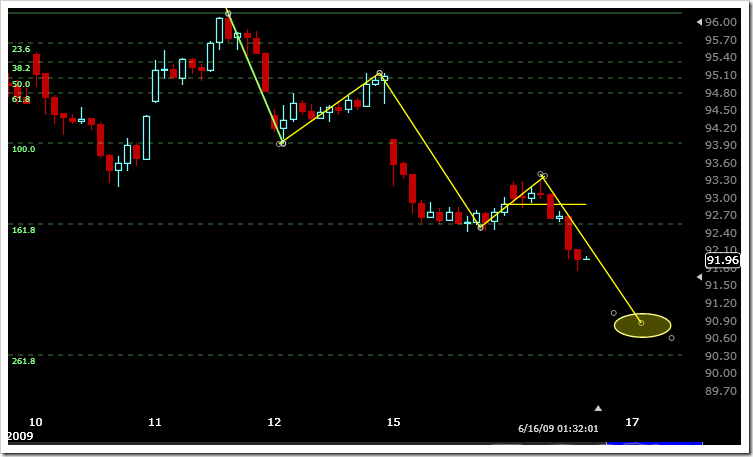
no rebound at all.  bears quite in control.  major wave structure is here.  a larger time scale than the one i usually posted here.
 

image


1:04pm

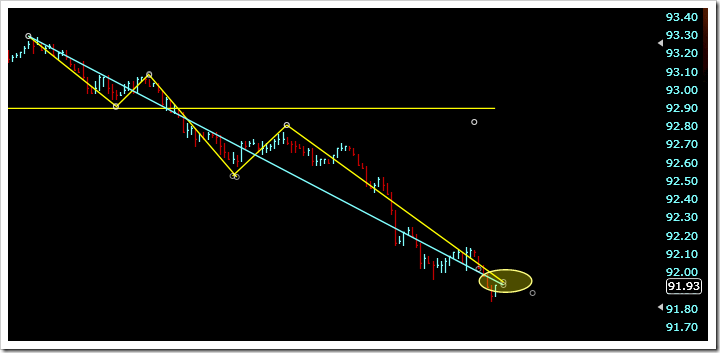
perfect wave structure.  We may see some reversals from here. sell TWM @ 43.83, $2 in the pocket, will buy back.    I will leave BAC and one other short for a while.  at beginning stage of drop off, there is going to be some shake off action.  be cautious bear.
 

image


12:39pm

new target, not far though


image


12:34pm

Target reached.  but this wave may further extend after some consolidation here.  wave 5 is extend and now we are in 5 (3).


image


12:18pm

Quick idea:


image


11:54am

To indentify good entry point, we need to focus on both time and space.  As you see from the 1 min chart below, yellow marks are my projected moves in early trading hours.  It seems that space wise, i am doing very good, both low and high are right on my target, but time wise, I am 3 hours early.    I have to say, timing is more important.  Dow will visit 7000 or 10000 eventually, but key question is which first … :)


image


11:17am

look at the solar sector, LDK, YGE, STP etc.  i’ve mentioned weeks ago that “if there is any sector i wanna to go long, it will be solar”.  


11:12am

the day after MDD most likely closed as a doji.  so the best strategy is either 1) no action; or 2) sell on rally & buy on dip...   very short term trade, not for swing.  also my coin system says it’s up day: http://rollinglines.blogspot.com/2009/06/coin-prediction-0615-0619.html

June 15, 2009

Sell signal

Both SPY and XLF have sell signal generated today.  In the weekend review I wrote  “I do not believe market has the strength to break above the multi resistance level without any consolidation.  also Monday, 6/15,  is an important time level that could lead to a big reversal.”   We indeed see a sharp selloff today and it forms a MDD. 

This is the beginning of a new down leg, so build the midterm short positions slowly.  At the early stage, market can be very choopy.  


A little more charts are added to the trading blog for subscribers.


image

Sector overview

Technology is still the strongest sector and health care the weakest one.  financials are sitting on the 50ma right now.


one thing need to be noted is that XLF topped already in early May.


image

06/15/2009 intraday analysis

4:01pm

the day is over.  today is the MDD.  if you do not know what is a MDD, check this post below.

Commodity looks toppy and transport is leading the down.  Financials are weak and our BAC shorts are working well now.


image


3:22pm

50ema finally touched.   Some readers may know that i like to enter positions on 50ema rather than 20ema.   it’s like in a boxing game, when opponent is fully extended, it is the best time to send out your punch…


image


3:11pm

The only question remains is if we have a sharp rebound in last 30 minutes.  i see some people are still expecting that happen.  usually in trend day, it close at LOD.


1:58pm

this is the most bearish case…


image


1:48pm

For those not familiar with what a major distribution day (MDD) is, here is the chart.  when $NYDNV:$NYUPV > 9, people call it a MDD.   Now the reading is 17, so if we close now, it’s a MDD.  There are many “rules” about MDD, we can talk about it later…


image


1:45pm

range bound scenario plays out.  Bears completely in control so far.  let’s see if we have a major distribution day here.


1:00pm

1st resistance @ 20ema.  i think bulls should break higher from here to the 93 zone. 


image


12:54pm

Another intraday scenario is that we are having a range bound here.   This is a very bearish sign since no real rebound and we can still test 20/50ema resistance.


It’s need to be noted that this is only intraday discussion.  my midterm view never changed…


12:39pm

1st target reached.  next 2 hours will be good for bears. 


12:14pm

my thoughts for today.


image


12:07pm

another H&S pattern for EUR/USD.  target 1.3


image

11:59am

bulls, don’t expect the gap today get filled soon.  sell next rebound and get exit. 


11:55am


image


11:35am

potential trend day.  short at every rebound to the key resistance line.  period.


12:56am

Futures are off 5 points now and dollars are strong.   Tomorrow could be the day for bears.

June 14, 2009

SPX weekly chart

A simple chart for this weekend.   I do not believe market has the strength to break above the multi resistance level without any consolidation.  also Monday, 6/15,  is an important time level that could lead to a big reversal.  Of course, it can be one day off the chart, so if we indeed see the reversal Tuesday again, do not surprise.


image


Also next week is the OE week.  June is big month for options and many leaped calls will be expired.  Both equity and index put/call ration has been staying in a very low range for the past three months.  Option mm have to do something next week, or their loss on the calls they wrote could be a horrible number. 


Ending diagonal is still my current view and i tend to believe 1) market peak is 6/11; 2) the peak is next Tuesday and we reverse at the end of that trading day.  I prefer 1 more.


One more daily chart below:  momentum negative divergence and volume is fading.  This rally won’t sustain any more.


image


EWI has a different count, just paste below for your reference.  


image

Coin prediction 06/15-06/19

Mon: down

Tuesday: up

Wed: down

Thurs: down

Friday: up

June 12, 2009

06/12/2009 intraday update

5:47pm

market closed with little gain.  will post a weekend summary tomorrow.  Good weekend, guys…


2:34pm

VIX has a sharp pop up right after my post.  any news? 


2:28pm

the market is more than boring… SPX and VIX is down at the same time.  If we closed the week like this, next monday will not favor bears.   I guess something big is coming.  BB is tightening now…


2:05pm

reentered BAC short @13.74, give it one more try here. 


2:00pm

bulls stand above the key resistance.  cover BAC, at least keep my 10 cents profit ~~


1:30pm

A bear’s view on the market.  it will be totally different from a bull’s perspective… :P


image


1:25pm

Today’s leader BAC is retesting the 50ema.  let’s see what will happen.  I entered the short position half hour ago and stop is slightly higher than today’s top…


1:03pm

hold it or break it


image


12:38pm

Everything is fine with bears right now.  Every attack from bulls have been pullback before the 50ema on 5min chart.  a very good sign for bears.  expect more down from here.

June 11, 2009

Ending diagonal possible

The original post is here http://rollinglines.blogspot.com/2009/06/ending-diagonal.html


Today’s fake pop gets well into the short zone…


image