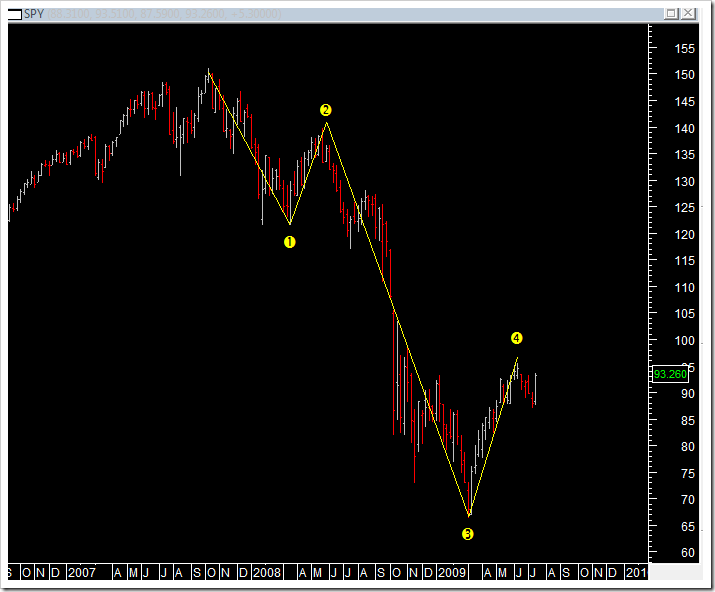
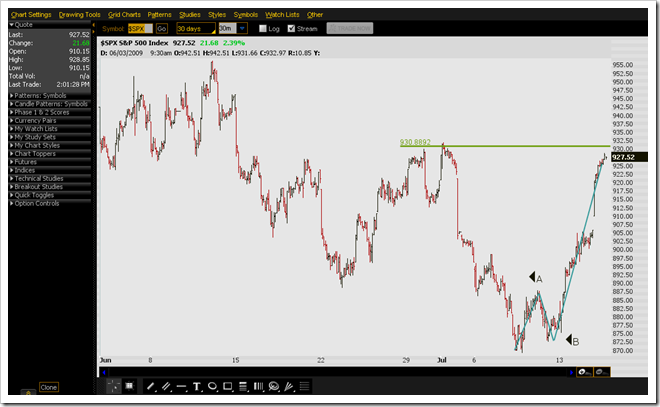
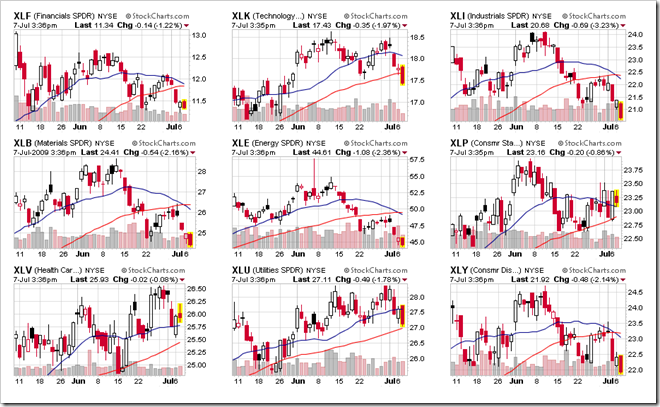
July 31, 2009

07/31/2009 intraday update

2:39pm

you may notice that my posts are obviously far less than a month ago.  this is simply because i have no position and I have no idea where the market is heading in the short term.  OIL is strong today and now the question is when we will take out 1000, today or next week. 


There are some negative divergence on the daily channel, but I will not short at this level.  market in consolidation phase and it can break up or down anytime.  I think bulls have more edge now.  i just do not want to chase the high at this level…


11:54am

negative divergence on daily chart, a sign of topping…

July 29, 2009

07/29/2009

1:35pm

we just make a lower low today, so short term correction is already in play.

tomorrow may be the day

just come back from a Tennis match, Serena Williams vs Na Li (China).  it’s the first time for me to watch a world-class Tennis match by the court, so still very excited…:)

Future is down and Asian market finally have a red day, so tomorrow might be the day bear is waiting for. 

I have no position right now and I need to see the retracement level to tell whether this is a buyable dip…

July 28, 2009

07/28/2009

2:13pm

orders stopped out.  looks like I need to take some rest these day :)


2:05pm

SPY 15min chart.  it looks like a break out and retest to me

image

1:06pm

enter some short here.  only for very short term trade. 

down day tomorrow

many of my trading signals are pointing to a down day tomorrow.  i don’t know what more can i say in this new-high-everyday market…

July 27, 2009

07/27/2009 intraday update

3:01pm

this kind of consolidation is not favorable for bears…  One good sign i saw is that most of the stock forums i go are going bullish right now, even some previous big bears…


1:54pm

intraday action looks like a bull flag.  bulls can still go higher without a pullback here? 

Daily chart

Daily channel is close to the top

image

SPX weekly channel

Red arrow place is the limit of this rally.  it may fail anytime before that…


image

SPX coin system July 27 – 31

Mon: down

Tues: down

Wed: up

Thurs: up

Fri: down

July 26, 2009

Bulls in control

After last week’s price surge I speculate that this bear market rally may extend another 2 months before falling down hard.   From market breath indicator, this rally is indeed broad market rally and the number of stocks reach their 200ma has reached a high of two years.


I expect some pullback next week, so key question is are you willing to buy this dip.  I have no answer to myself yet.  I will check the strength of this pullback and then make the decision.  In the long term, nothing changed.  I really do not like to trade against the big trend to catch the last profit in the counter-trend rally.

July 24, 2009

07/24/2009

2:24pm

enter some short here @ SPX 975.5.  I will be out for rest of trading hour.  let the stop do the rest.


1:48pm

i have no move today.  wait for the opportunity to get in for short.  today may push higher

July 23, 2009

07/23/2009

12:21pm

as i said in a previous post, when market makes new high, I changed midterm view to bullish.  i have no crystal ball whether the rally top is 1000, 1050 or 1100, but this is definitely not the start of the bull market.  long term picture is still very bearish and we have lots of downside to go.   time will tell…


12:13pm

the market keeps the strength.  though i did not profit from this rally, i am glad I did not get caught into it…  no short entry sigh yet, bears need more patience.

July 22, 2009

07/22/2009 intraday update

12:52pm

I will get into any position today.  i don’t chase the high from there and i don’t short either when we make new high.  just take a rest.  usually after new high break out, overbought signals will become useless for a while.  this short term manipulation is so strong……


12:23pm

if someone really want to short, energy sector could be a good one. 

July 21, 2009

07/21/2009 intraday update

4:03pm

closed the position with a small lose.  it’s not the reversal day I was expecting…


3:37pm

good thing for bears we indeed see some impulsive down wave this morning, could potentially be wave 1 and 2 right now.


3:24pm

5min chart is a good entry.  close to 50% retracement right now.


image


1:00pm

Since market made intraday new high already, I have to reevaluate the market.  Previous H&S pattern is not valid any more.


12:33pm

today looks like the reversal day so far.  bulls need to take a break at least.

July 20, 2009

When a trader goes crazy… :)


and can be more crazy…


07/20/2009 intraday update

4:26pm

it’s almost the 6th day market closes at high of the day.  still any bear around???


2:52pm

get the position covered with a push…  the market refuse to head south today


2:00pm

bounce back to 946 level again.  market is strong  and i don’t know what will beat it down… i hold the view that either today and tomorrow should a reversal day…  extremely overbought level, at


1:11pm

946 level is a good short entry for brave bears.  use some small position to test water…

July 19, 2009

weekend review

Last week’s dramatic move turn many of my bear comrade into bull’s camp, as a super bear and I will hold my side and wait for the glory of the bears. :) 


In the long term, there is no doubt we are in a super bear market.  Any number in the SPX 900 range is a luxury years later…


For the midterm, indeed many possibilities are available at the current stage of the market.  


In the short term, we will see a pullback for sure based on the current overbought condition.  200 daily EMA is within inches and I don’t think bulls can take that out in the 1st time.  The retracement level will decide the midterm scenario.  My primary view is that we will still in a irregular a-b-c wave 2 correction and wave 3 will start very soon early next week, either Monday or Tuesday, leading the market down to 820 region as a initial stop.  In this way, H&S pattern is still valid and just a little tilted like mine :)


image


For the 2nd scenario, bulls are wild.  everything is in the chart below.  As I said, new high is the criteria to define this one…


image

SPX coin system

Mon: down

Tues: down

Wed: up

Thurs: up

Fri: down

July 17, 2009

07/17/2009 intraday update

1:15pm

this  might be a most calm OE day i ever seen:)  the sign is market refused to turn down even very overbought level and many signal can be eased away in such a consolidation. 


11:23am

based on the overbought condition, i would expect to see more pullback today

July 16, 2009

07/16/2009 Intraday update

1:54pm

based on measured move and momentum, we might have a higher high ahead… 


image


1:50pm

it break out right after I post the chart below.  Market is really strong.


1:47pm

this CT is not good for bears.  five waves inside is very clear.


image


1:21pm

SPY 5min chart.   two false breakout already, let’s see if third time is different…


image


12:45pm

after MAD, it’s likely to close as a doji.  lots of overbought signal, expect some pullback at least from this level.

July 15, 2009

Midterm picture

I’ve not update a midterm picture for a while.  but since today’s market action indeed surprises me, i need to give it revisit here. 


First of all, we need to have respect to the market.  We can have predictions, we can have judges, but when those are against the market, market is always right.  Just like Livermore said “Markets are never wrong, opinions often are.”   All we can do is adjust ourselves and follow the market…


Based on the chart below, everyone may raise the question whether early June’s high will be taken out.  That’s also my midt.erm decision point.   Before it’s broken out, i remain on the bear side; once we have new high, i will join the bull camp for a few more weeks.   It needs to be pointed out that both retracement level and time frame are already perfect for 4th wave, an extended one does not have to be necessary…


image

A quote

From stocktiming today:


“Do we close our position, or add to our short position with the building divergence on the VIX?
There is no perfect answer here.  If they run it up further tomorrow, you won't be happy.  If the broadening VIX divergence kicks in and the SPY goes down, you will wish you had added to the short. 
My life rule is, "don't challenge a guy who has a gun ... it might just go off".  So, don't challenge Mr. Wall Street by adding to the short.    Okay next, invoke the sleep rule ... if you might lose sleep at night due to a position you are holding, close it because you are out of your comfort zone. ”

7/15/2009 intraday update

4:52pm

today is a trend day and again the MAD.  VIX closes in green. 


2:02pm

enter some shorts here.  if this is A-B-C structure as drawn, this is close to the extreme; if June-23 to today is an irregular A-B-C correction, we will have pullback and then a final wave 5.  I gave scenario very little consideration in the past two weeks; even it comes true, it’s very rare based on wave 2 to wave 1 time ratio.


image


11:59am

previous high is the key to watch.  my midterm view has not changed.  today should be the top of this rally.


image


9:27am

future is indicating a big gap up.  let’s see if gap get filled or new high within one hour.  today is the reversal day to me.


1:41am

I know quite some bears are pissed off today.  market keeps edging higher at critical resistance levels.   But just remember how many feel regret last week when they do not have chance to enter short above 900 levels.  Now 900 level is back, so you dare to add or not?  :) 


set your stop while, reenter at each pop up.  this is how a good trader trades in a bear market.

July 14, 2009

7/14 intraday update

1:56pm

bulls definitely lost the momentum, bears need to acclaim themselves…


image


1:31am

market still in consolidation.  I believe drop off can start any time…


11:12am

Again, after MAD MDD, it usually closed as a doji.  so maybe a boring day.  but there are some stocks good to short here…


11:01am

bears have to take out the yellow line…


image

July 13, 2009

07/13 intraday update

3:55pm

some of my orders get stopped out.  wait for the last 5 mins to add some short. 


2:47pm

market edged a little higher and now fade down.  it’s time for bears to have some faith and i am sure all these will be rewarded very soon…


1:33pm

the high of the day just passed, it should also be the high of this rally…


1:07pm

market makes a big u-turn in the past 12 hours.  the most possible move is drawn below.


image


1:15am

We will see 850 region first before we have a decent rebound.  I think we will be there by OE day.

July 13-17 SPX coin system

Monday: down

Tues: up

Wed: down

Thurs:down

Friday: down

July 10, 2009

07/10/2009 intraday update

3:59pm

guys, have a nice weekend…


3:24pm

just a reminder that it’s not time to go long from here.  market can collapse anytime during July… 


3:16pm

wow, look at AIG!  another 30%, but it’s a reversal this time.


image


1:50pm

still in the consolidation range…


7:44am

no sleep and i was watching the future rolling down over the night~~


5:05am

It’s 5am on eastern time already and I am still working here.  so i have to take some time off in the trading hour i guess…  the market may gap down and no look back.  if we have a rally in the first few trading hours, it’s a gift for bears…

July 9, 2009

07/09/2009 intraday update

3:57pm

our magical circle is working well this time :)  it says tomorrow is going to be very bloody…


image


3:49pm

SPY 5min chart, close to the 2nd entry


image


3:28pm

wow, AIG drops another 30% today~ this is why they did the 20:1 reverse split???


3:12pm

I worked too hard and not slept much last night.  it was a very good sleep just now:)  i find my FXP is now at exactly the same price as I entered two hour ago, $12.79…


1:33pm

ok, i am adding a little short here and then go sleep..


12:30pm

on the larger scale, this is a retest.  so still, the market can fall any time. 


image


12:24pm

market is stronger than I expect.  the next hour will tell if market has resumed the downtrend or this correction still need some time…


image

July 8, 2009

07/08/2009 intraday update

wow, a big typo below, just correct it~  sorry guys


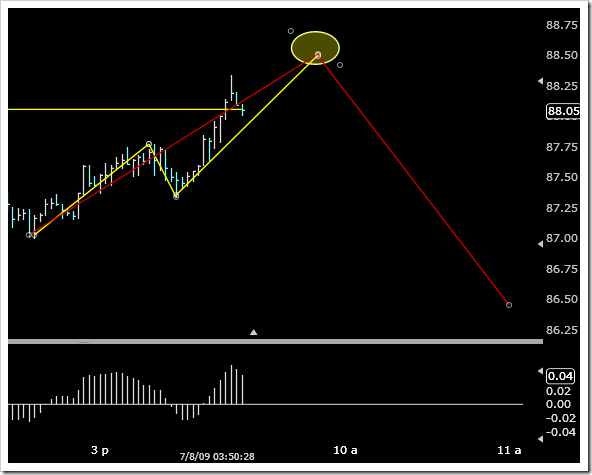
3:51pm

new no low ahead tomorrow…
 

image


3:37pm

OK, bulls finally broke the resistance.  This is more consistent with my expectation since based on my wave count, this one is on a larger degree than the ones we have in the past two days.  Also the positive divergence should lead the market higher.  But again, main trend not change and no longs from here…


image


3:27pm

it holds again this time:)   if you are doing ST, you really do not need to care about these intraday noises, just trade the main trend and move your stops slowly when you get the profit. 


image


3:02pm

hold on your short well, it’s just a shake.


2:55pm

SPY—to our magic line again, not sure if it will hold this time.  negative divergence on different time frames. 


image


2:09pm

this is SPY


image


1:53pm

if you can not find a entry, just use our magic line… see how well it plays out for SDS?  it’s all the same for SPY TMW DIA…


image


12:38pm

I hope you guys are having fun with this downtrend.  Today’s key topic is weak dollar and weak gas, (yeah, we seldom see this) and CNBC is talking about whether US dollar reserve currency status will be replaced or not.  This is a good question.  My answer is yes, but not now.  we will discuss this more in later days…


4:47am

the future is turning green right now, we can see some rebound tomorrow in the morning. 


3:25am

market still has lots of room in the midterm.  if market up tomorrow, it’s good chance to add short.

July 7, 2009

07/07/2009 Intraday update

4:05pm

it’s very meaningful today to take out previous lows.  a big day for bears!  Also, today is not even a MDD, so expect more volatile days ahead. 


A quick look at sectors.  only defensive sectors are holing about 50ma right now, a self-speaking chart.

image


3:43pm

the ceremony just finished, it’s so moving…


2:57pm

Someone still remember this chart?  i was too aggressive when i paste this a month ago, but if we are lucky enough, this still may become true…


image


12:36pm

Usually, i only put this kind of drawing to our trading blog, today i’d like to share it here.  below is the hourly chart of SDS, a double reversal ETF.  this cup & handle pattern is the mostly popular one among IBD and it works really well in a bull market.   Many other reverse EFTs, like TWM, FXP, FAZ are having a very similar pattern.  Those ETFs will break out every soon…  If you have not enter them at a better a position, it’s not too late yet…


image


12:31pm

market is testing yesterday’s low.  I believe it will penetrate and get down to 870 region as a first stop… bears, be brave! :)


11:12am

I will be following MJ’s memorial ceremony today.  market is weak and trying to fight back to 5min 50ema, let’s see how it goes…

July 6, 2009

A short list

ALTR HOV PTEN TBSI XHB

a short list from my scanner today

Energy is weak

Two months ago, we set the target for this Oil rally as the yellow circle region.  On June 11th, the peak is just tens of cents away from our target.  On Jun 16th, the white arrow area, we call this Oil rally is over.  With today’s gap down, some CNBC experts join the weak-oil side.  It’s not a bad move for them at all, energy sector still has lots of downside to go and it’s late yet to make the call.  Just a reminder this is not the buy-dip time as J Cramer is talking about on CNBC.  To me it’s short everything wildly…


image

07/06/2009 intraday update

4:01pm

market is working towards upper channel and we just wait patiently here. do not long here and take this 10 point advantage, it’s very danger…


image


2:35pm

Basically, the topping process is over.   we can break out to the down side any time.   The best case for bull is drawn below and if that happens, it’s a great chance to get out longs for them…


image

11:50am

Our JRCC short is doing pretty well right and i am considering cover it here now and find another entry later…


image


11:40am

H&S pattern is testing the neckline right now.  once it’s break, measured move points to 82.

image

July 5, 2009

weekend review pending

my EOD charting software has some bugs right now and i am working on that.  i will post something is it get solved early enough…

July 6th – 10th SPX coin system

Mon: down

Tues: up

Wed: down

Thurs: down

Fri: down

July 2, 2009

07/02/2009 intraday update

4:02pm

market close at LOD, a typical ending in a trend day.  NYSE trading hour is extended to 4:15, but my trading week is over.  I will post something over in the weekend to review the general market.  Have a good holiday~! 


3:30pm

today, I did not mention this is a trend day, but you guys should be able to identify it easily after 11am.  gap down, no fill and new low--- a very tradable pattern.  


3:24pm

good effort by bears!  :)  both levels i mentioned are out now


1:05pm

last hour trading before a long weekend.  SPX is holding 900 and NASDAQ is holding 1800.  let’s see if bear can make a further move before the close.


2:56pm

it’s another MDD if we close the market now. 

image


12:43pm

btw, someone may say this selloff is triggered by the job numbers.  don’t think this way.  you will never be a good trader if you are following data like this.  these data only reflect yesterday.  study your chart and look forward…


12:40pm

this is the bloody wave three i was talking about.  lots more downside to come, this is really just the beginning.  so add short position at every rebound…  enjoy this ride to 666 in next three months :)


1:43am

tomorrow could be the day i am waiting for.  If it’s a gap up, a great short entry opportunity.

July 1, 2009

07/01/2009 intraday update

3:18pm

today’s action does not seems like a reversal day.  could be another push to 930 region.   I expect the coming drop to be very violent and bloody, so it must be either a very sharp intraday reversal or a gap down directly from the open.  definitely not like this.


1:57pm

In a day like this, only thing a bear can do is wait… we know our glory is yet to come…


12:43pm

A good head and shoulder pattern…  let’s see how this plays out


image


12:32pm

not a good day for bear.  trend day.  could close at the high of the day.